
Predicting New Structures in the Periodic Table with Harmonics
Transitions between elements and compounds

Visual Representations for Predicting New Structures in the Periodic Table with Harmonics
Given the new aspects and principles discussed, here are some suggestions for visual representations that can help in exploring and predicting new structures in the periodic table, especially focusing on harmonics and duality.
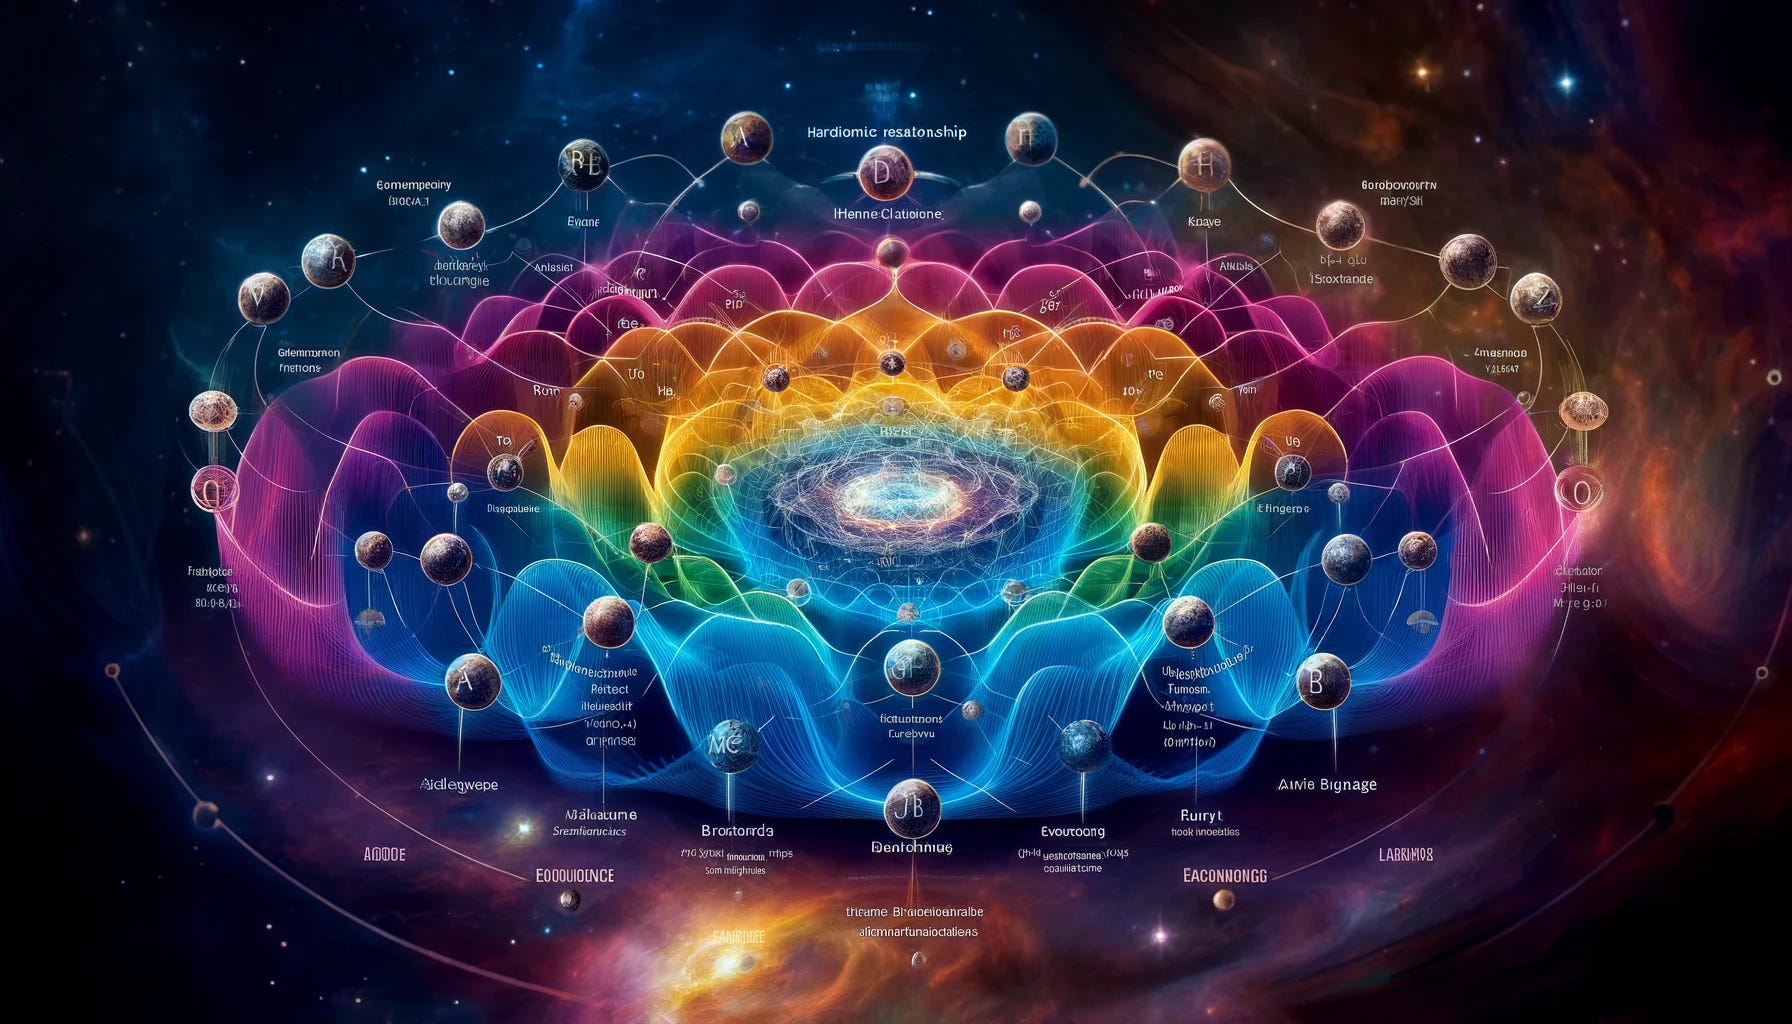
1. Harmonic Resonance Map
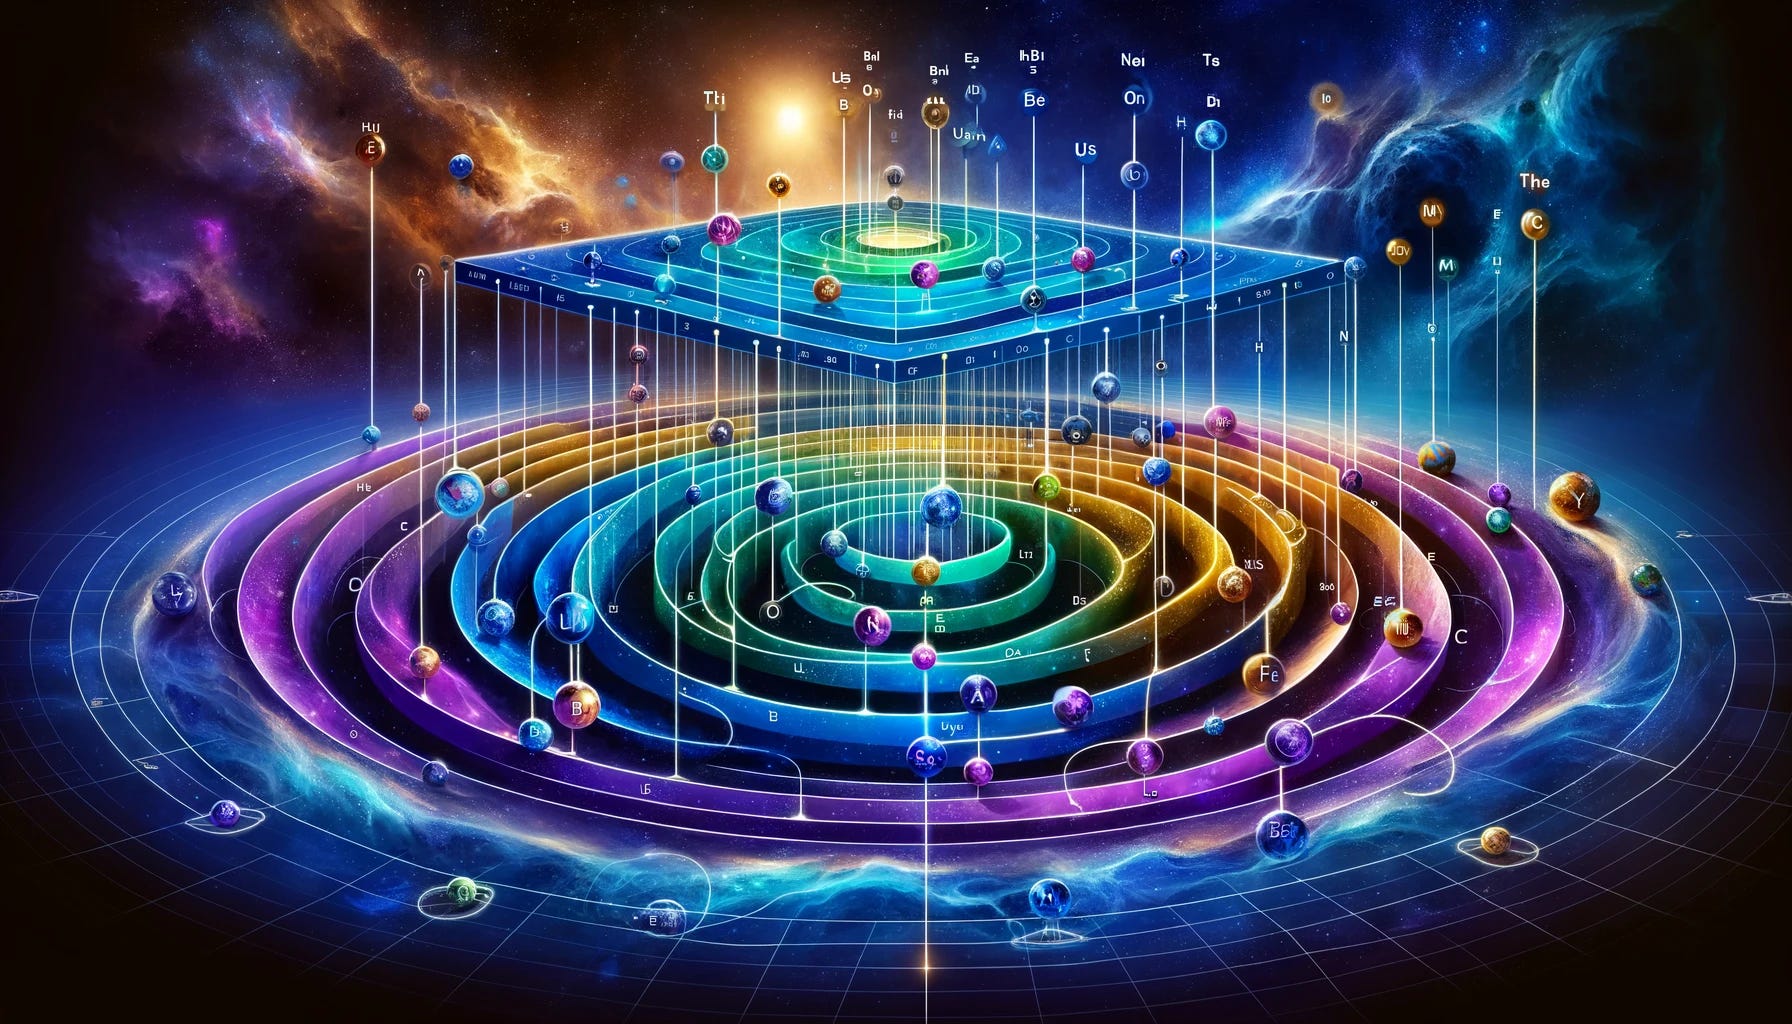
Concept: Create a harmonic resonance map that visually represents the harmonic relationships between elements. Use waveforms and resonant patterns to illustrate these connections.
Visualization Elements:
Waveforms: Use wave-like patterns to connect elements that share harmonic relationships. Different colors and shapes of waveforms can indicate the strength and type of harmonic connection.
Resonance Nodes: Highlight specific nodes where multiple harmonic connections intersect, indicating potential for new compounds or materials with unique properties.
Frequency Labels: Add labels indicating the resonant frequencies associated with each element or connection.
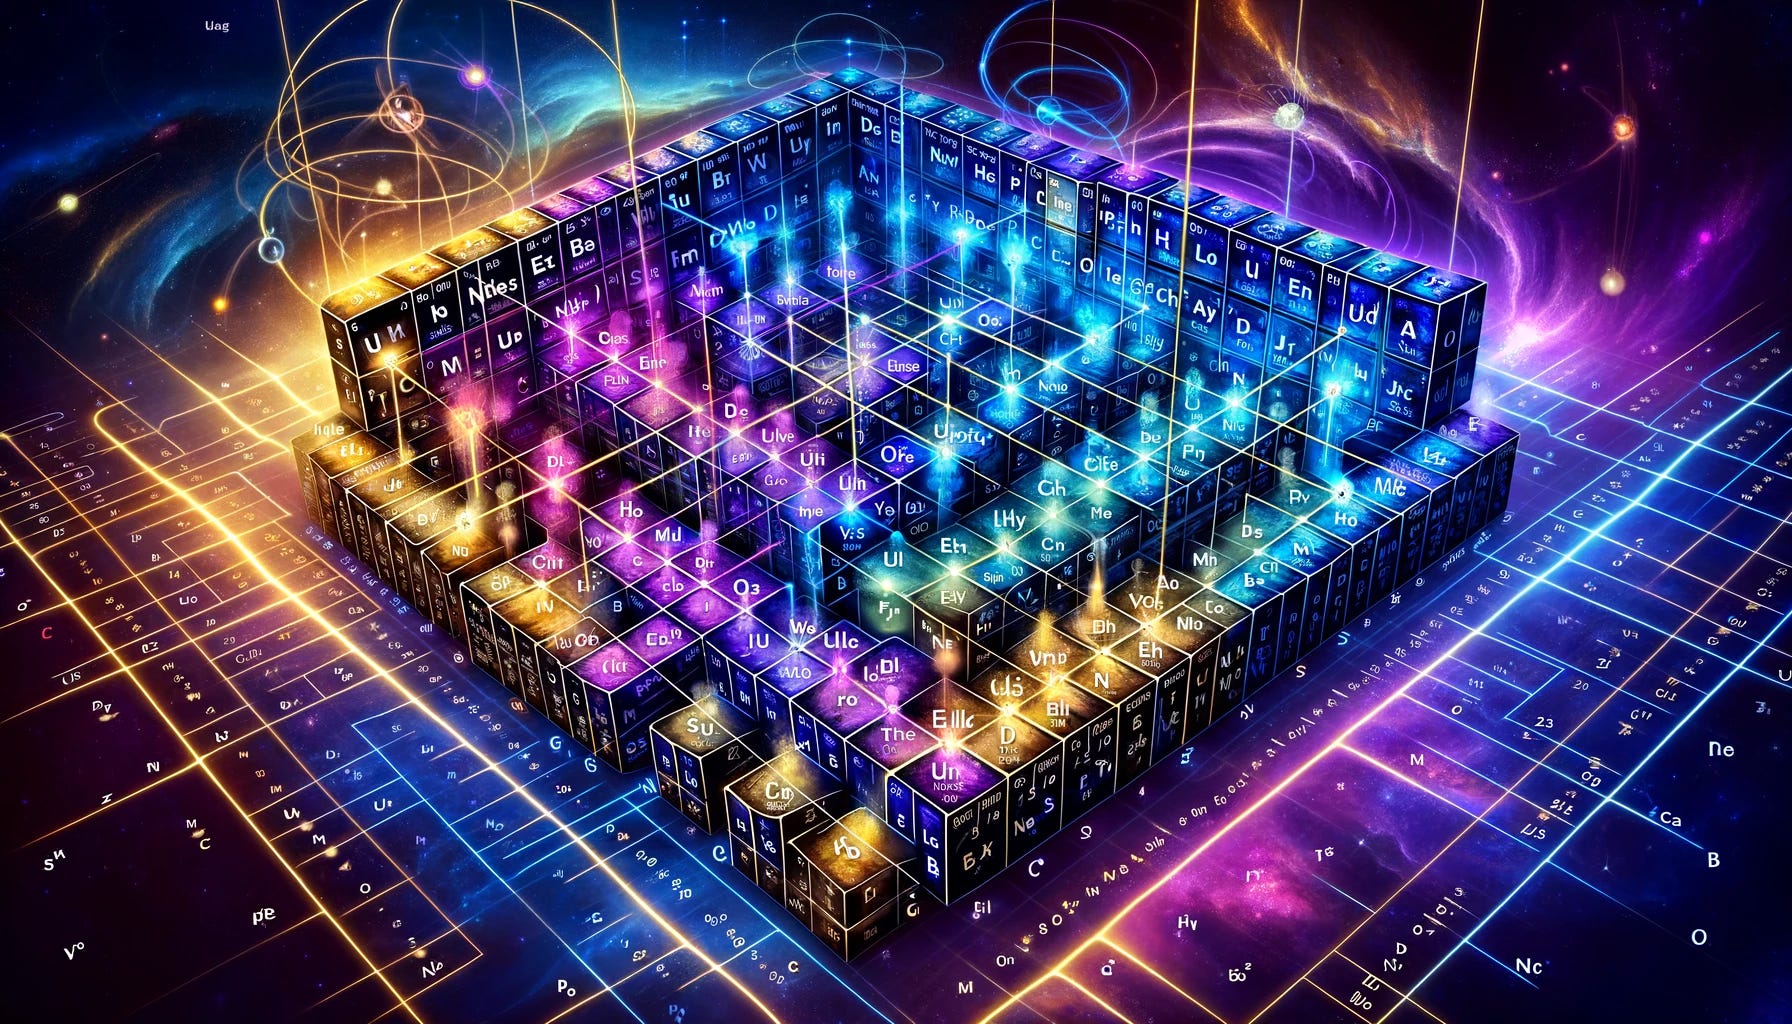
2. Dual Property Matrix
Concept: Develop a dual property matrix that shows the interactions between the dual properties of elements, such as atomic number and electronegativity, in a grid format.
Visualization Elements:
Grid Layout: Arrange elements in a grid where the x-axis represents one property (e.g., atomic number) and the y-axis represents another property (e.g., electronegativity).
Color Coding: Use colors to indicate the strength or type of interaction between dual properties.
Harmonic Lines: Draw lines connecting elements with similar dual property ratios, emphasizing harmonic relationships.
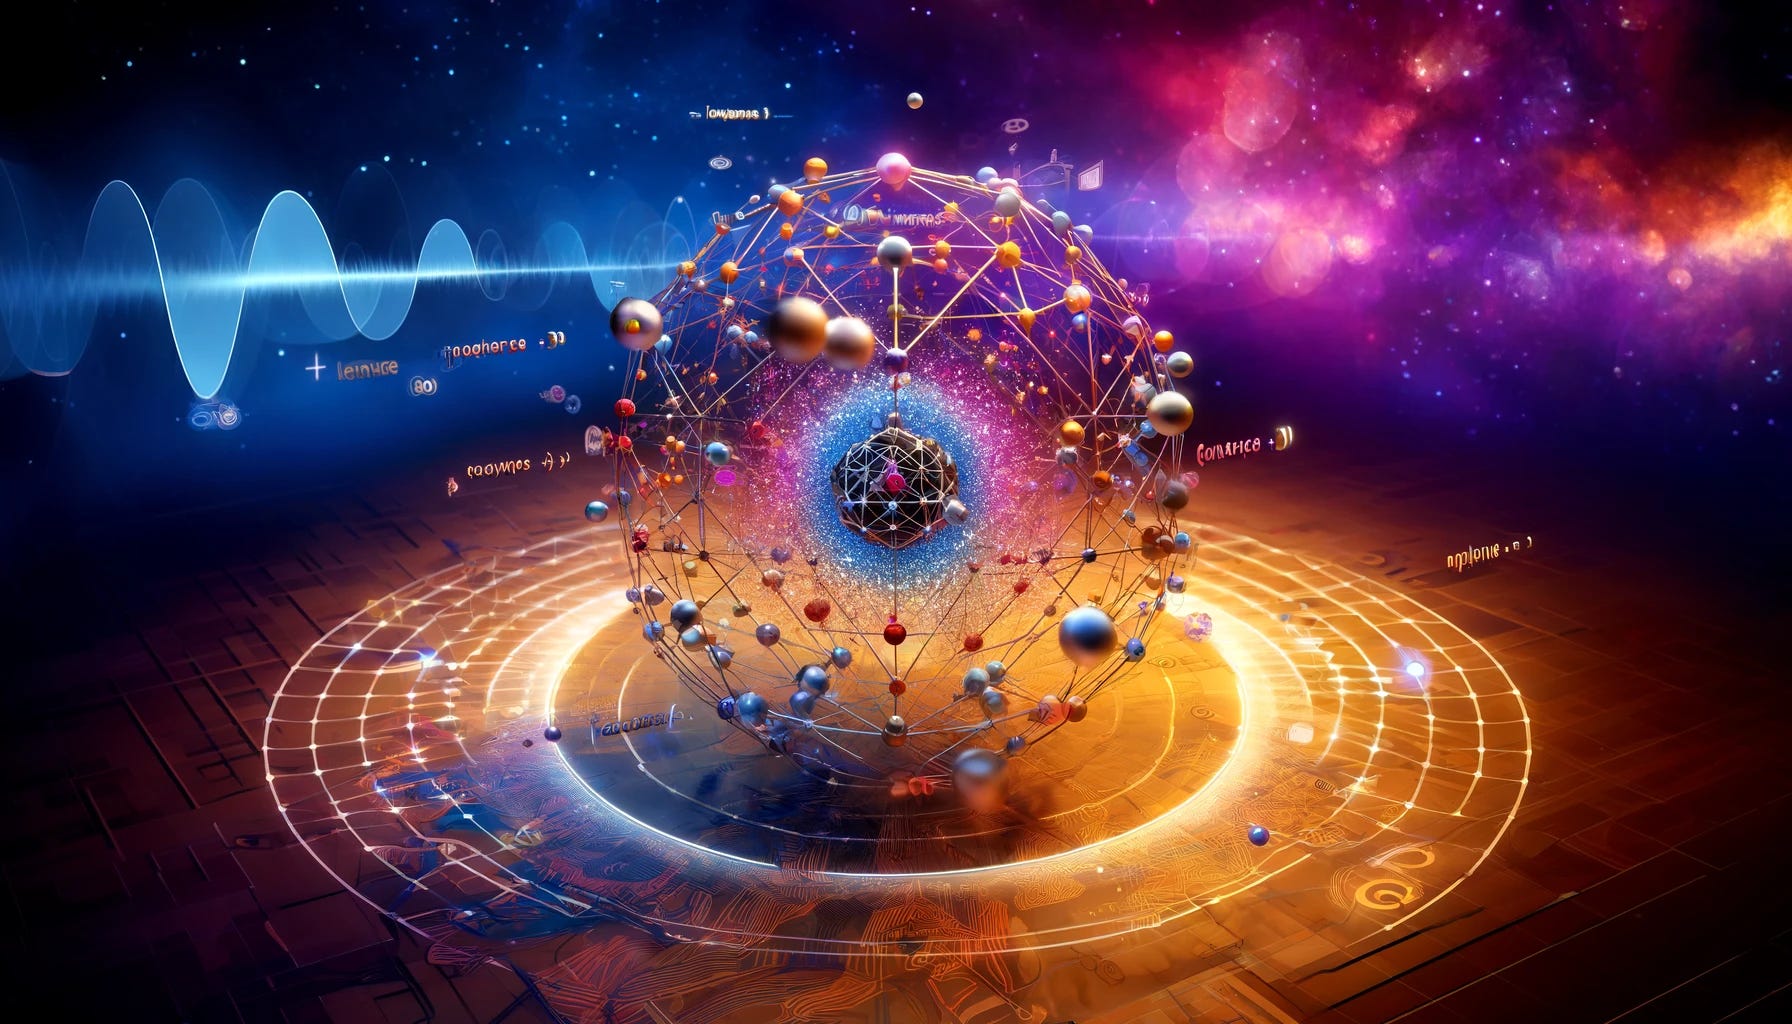
3. Quantum Coherence Sphere
Concept: Create a 3D sphere representing quantum coherence, with elements placed on the surface according to their quantum states and coherence levels.
Visualization Elements:
3D Sphere: Place elements on the surface of a sphere, with their position determined by their quantum coherence properties.
Coherence Paths: Draw paths connecting elements with high coherence, showing potential for entangled states or stable quantum systems.
Interactive Features: Allow users to rotate and zoom into the sphere to explore different regions and their harmonic relationships.
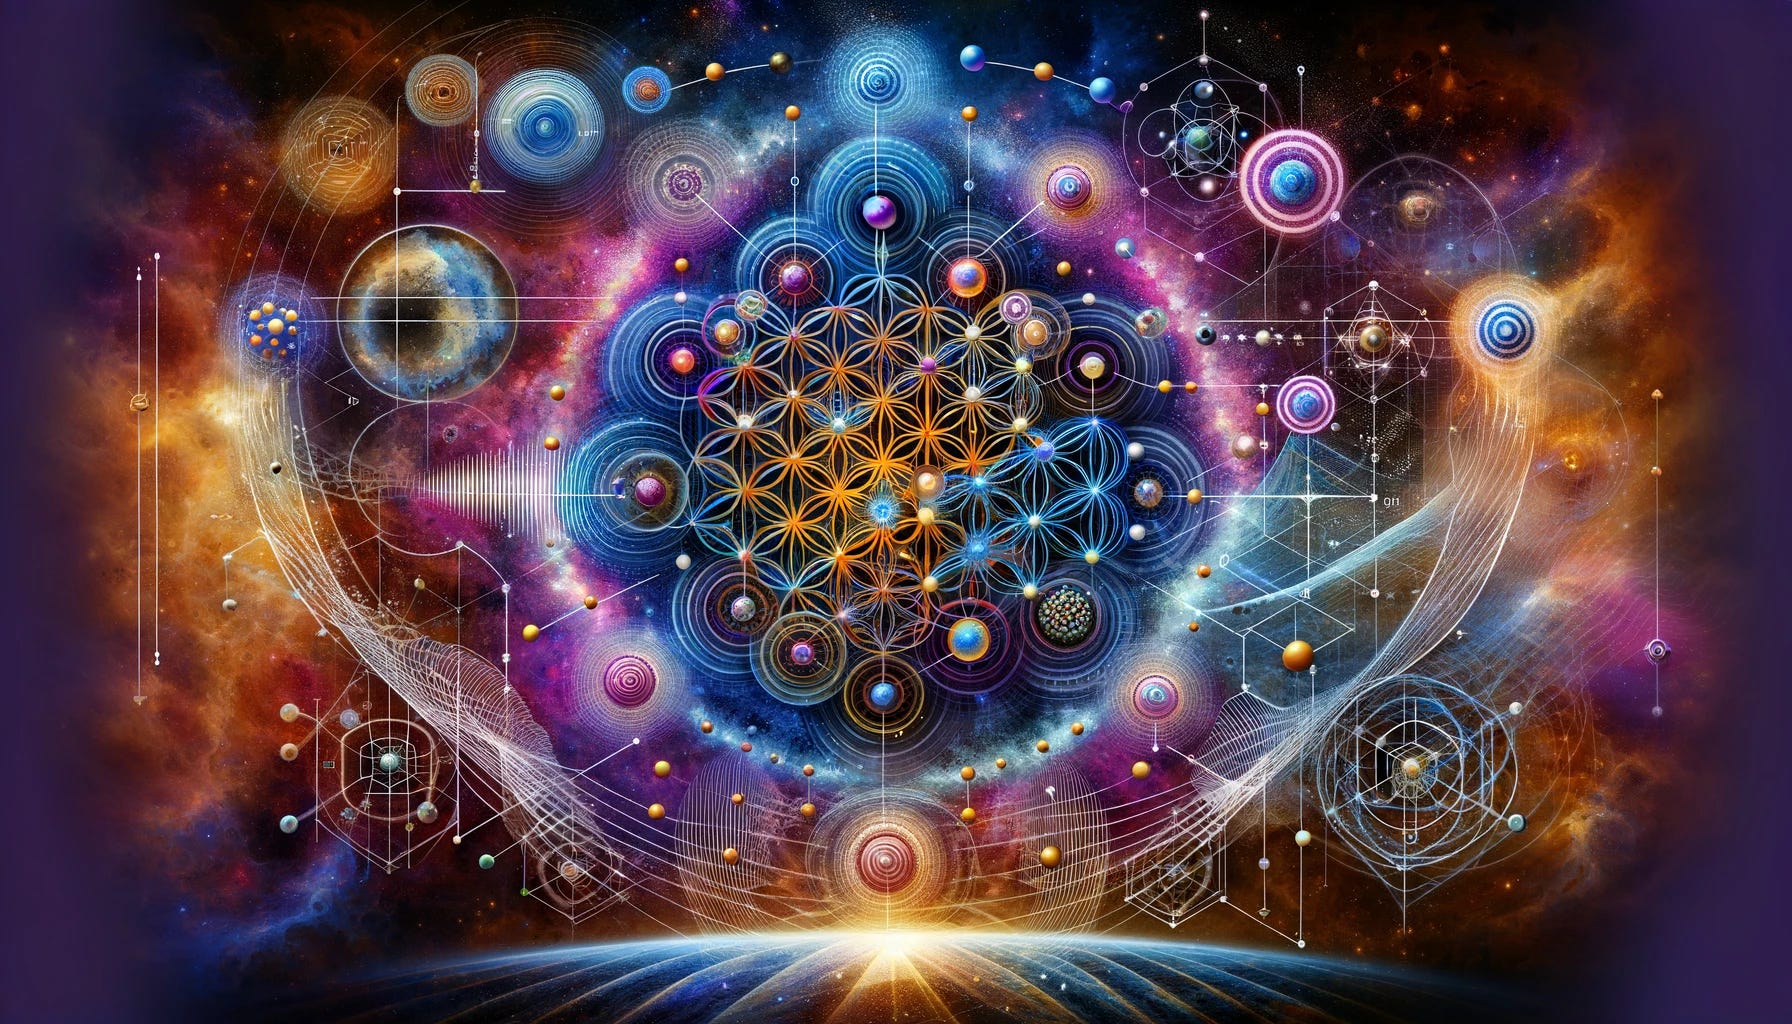
4. Flower of Life Expansion
Concept: Expand the Flower of Life pattern to incorporate new elements and structures, using it as a framework to predict and visualize new materials.
Visualization Elements:
Expanded Circles: Add new circles and intersections to the Flower of Life pattern to represent new elements and compounds.
Harmonic Waves: Use harmonic wave patterns to connect elements and predict new structures based on their dual properties.
Dynamic Interactions: Include animations or interactive features to show how elements interact within the expanded Flower of Life framework.
5. Energy Landscape Diagram
Concept: Develop an energy landscape diagram that maps out the potential energy states and transitions between elements and compounds.
Visualization Elements:
Energy Levels: Represent different energy states of elements and compounds on a vertical axis.
Transition Paths: Draw paths indicating possible transitions between energy states, highlighting harmonic and coherent transitions.
Color Gradients: Use color gradients to represent the stability and potential energy of different states and transitions.
Summary
By using these visual representations, we can explore and predict new structures in the periodic table with a focus on harmonics and duality. These tools can help visualize complex interactions, identify potential new materials, and enhance our understanding of the interconnected nature of elements.
The time to dream is now. It is now.
The Flower of Life new scientific theories and experiments

The Flower of Life is a geometric figure composed of multiple evenly-spaced, overlapping circles arranged in a flower-like pattern. It has been considered a symbol of sacred geometry and is thought to represent the fundamental forms of space and time. In the context of the
The Flower of Life new scientific theories and experiments
The Flower of Life is a geometric figure composed of multiple evenly-spaced, overlapping circles arranged in a flower-like pattern. It has been considered a symbol of sacred geometry and is thought to represent the fundamental forms of space and time. In the context of the
The idea of visual representation and the possibility of moulding laws from the various disciplines of science into philosophical, artistic, sociological proposals is fascinating.